 Browser GIS

A GIS in your browser: layers, attribute tables, styling, analysis and print layouts.
GISela opens GeoJSON, KML/KMZ, GPX, CSV, TopoJSON and zipped shapefiles as map layers, converts between coordinate systems such as UTM, Swiss LV95 or the British National Grid, and lets you style them by category, by class or as a heatmap. Edit attributes with a field calculator, run buffers, overlays, dissolves, Voronoi polygons or spatial joins, measure true areas and lengths on the ellipsoid, and print a map with legend, scale bar and north arrow. Everything runs in your browser.
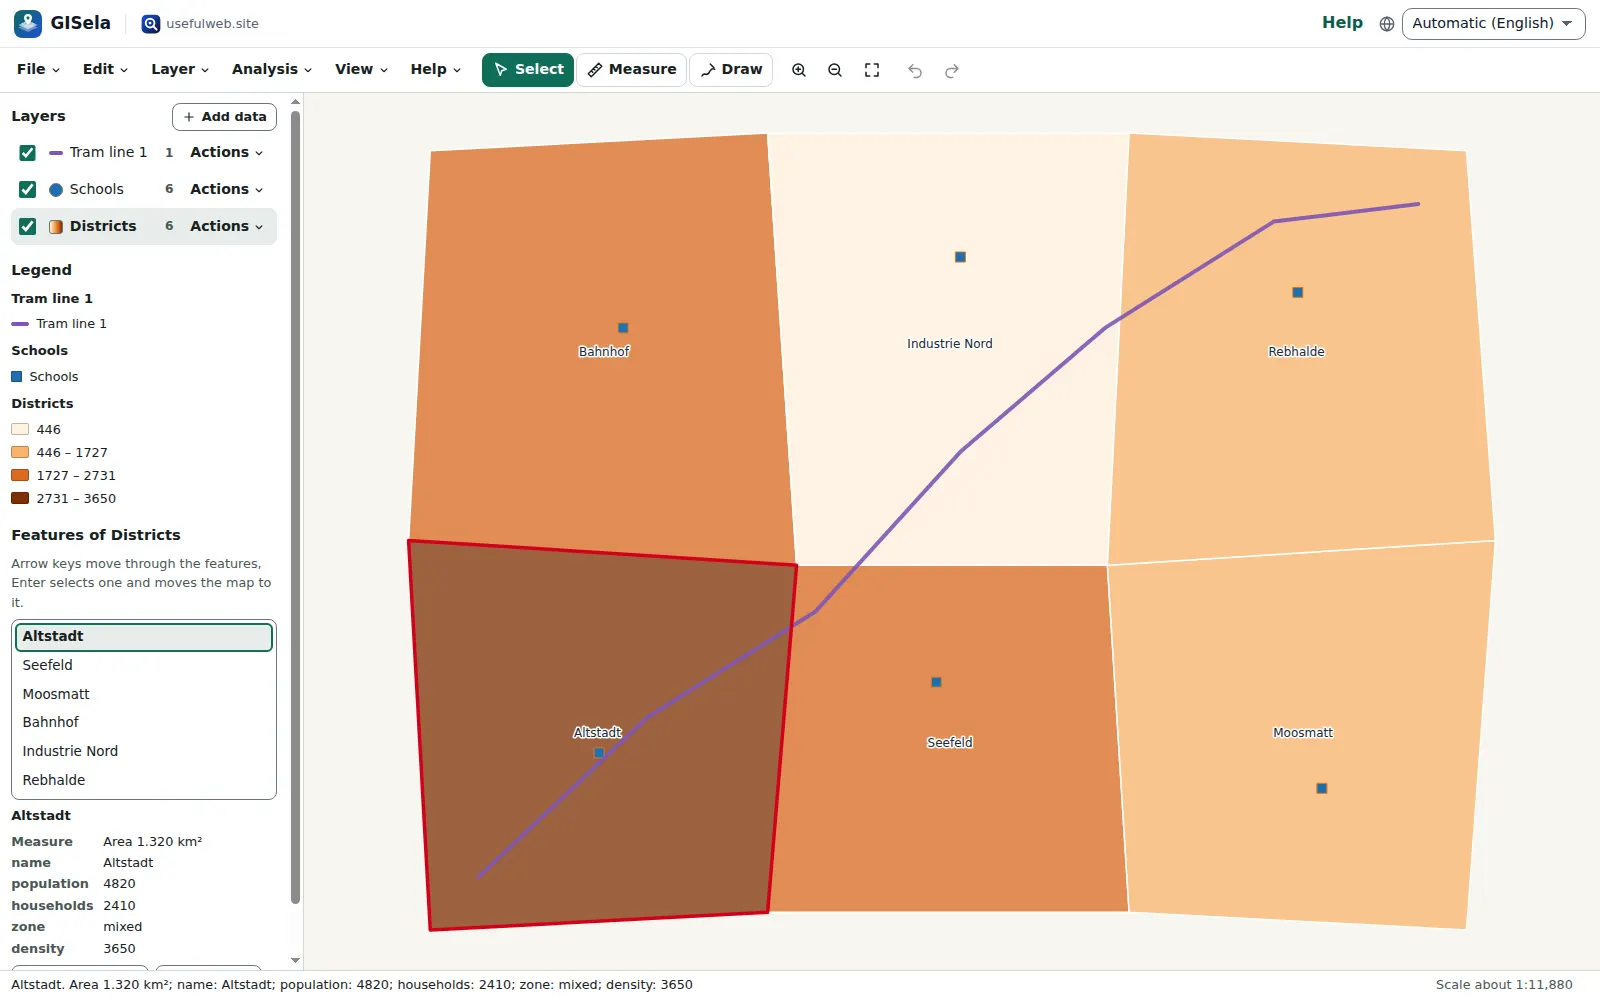
Screenshots
- Layers, styles and a legend
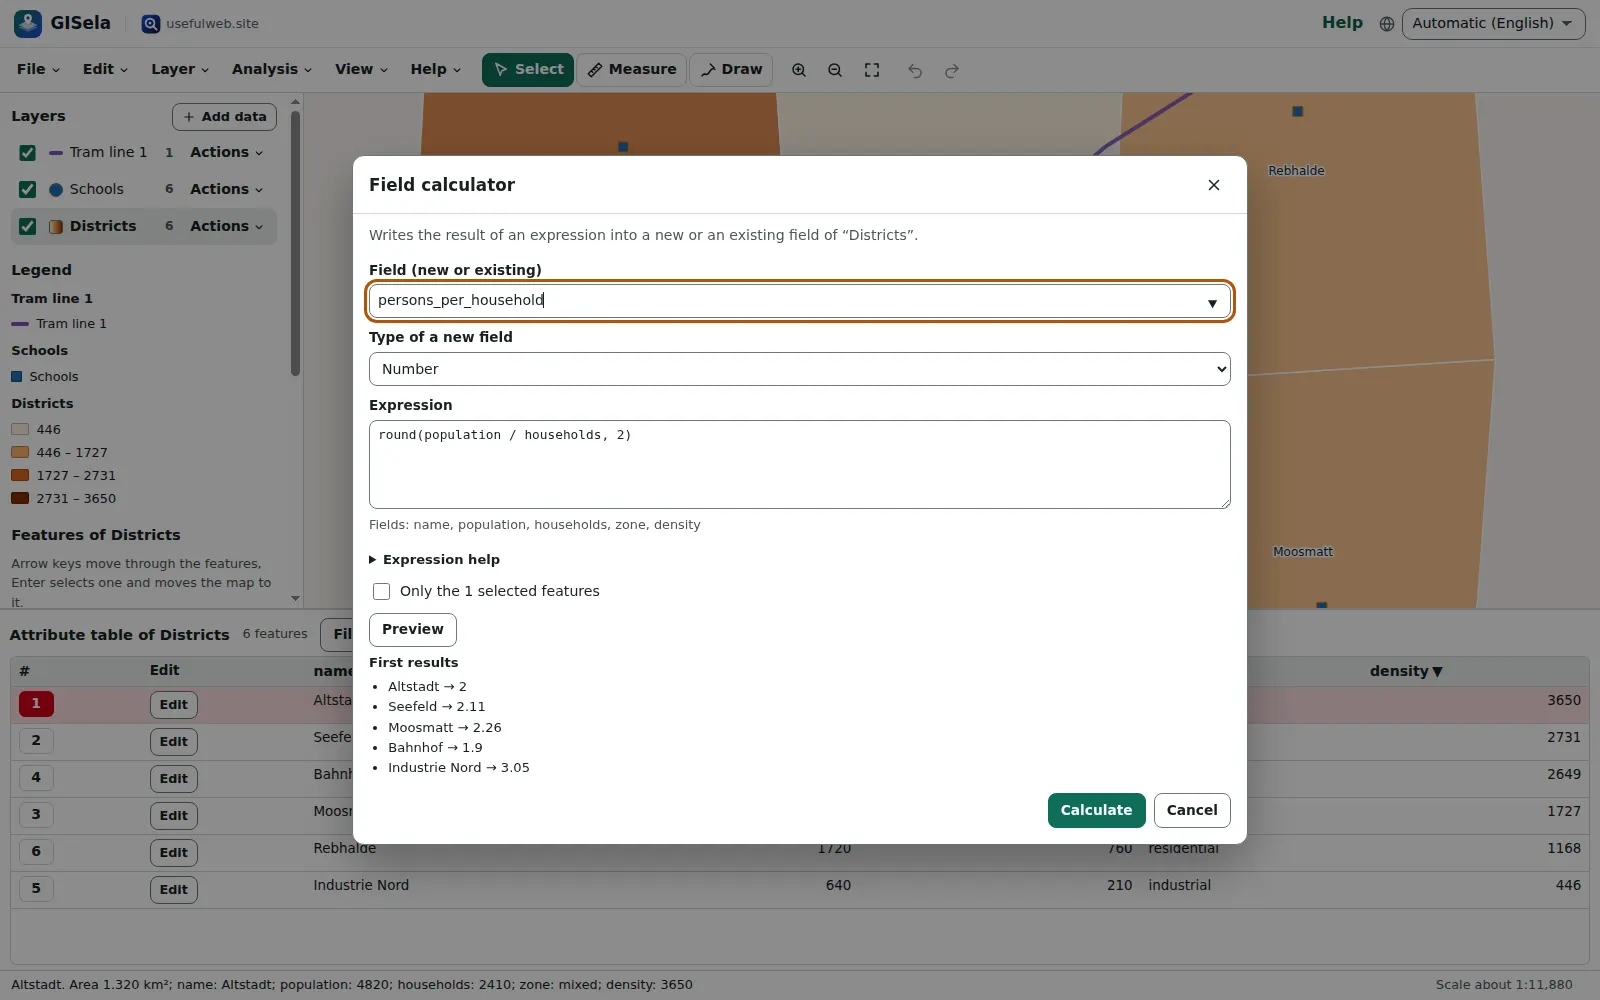 Attribute table and field calculator
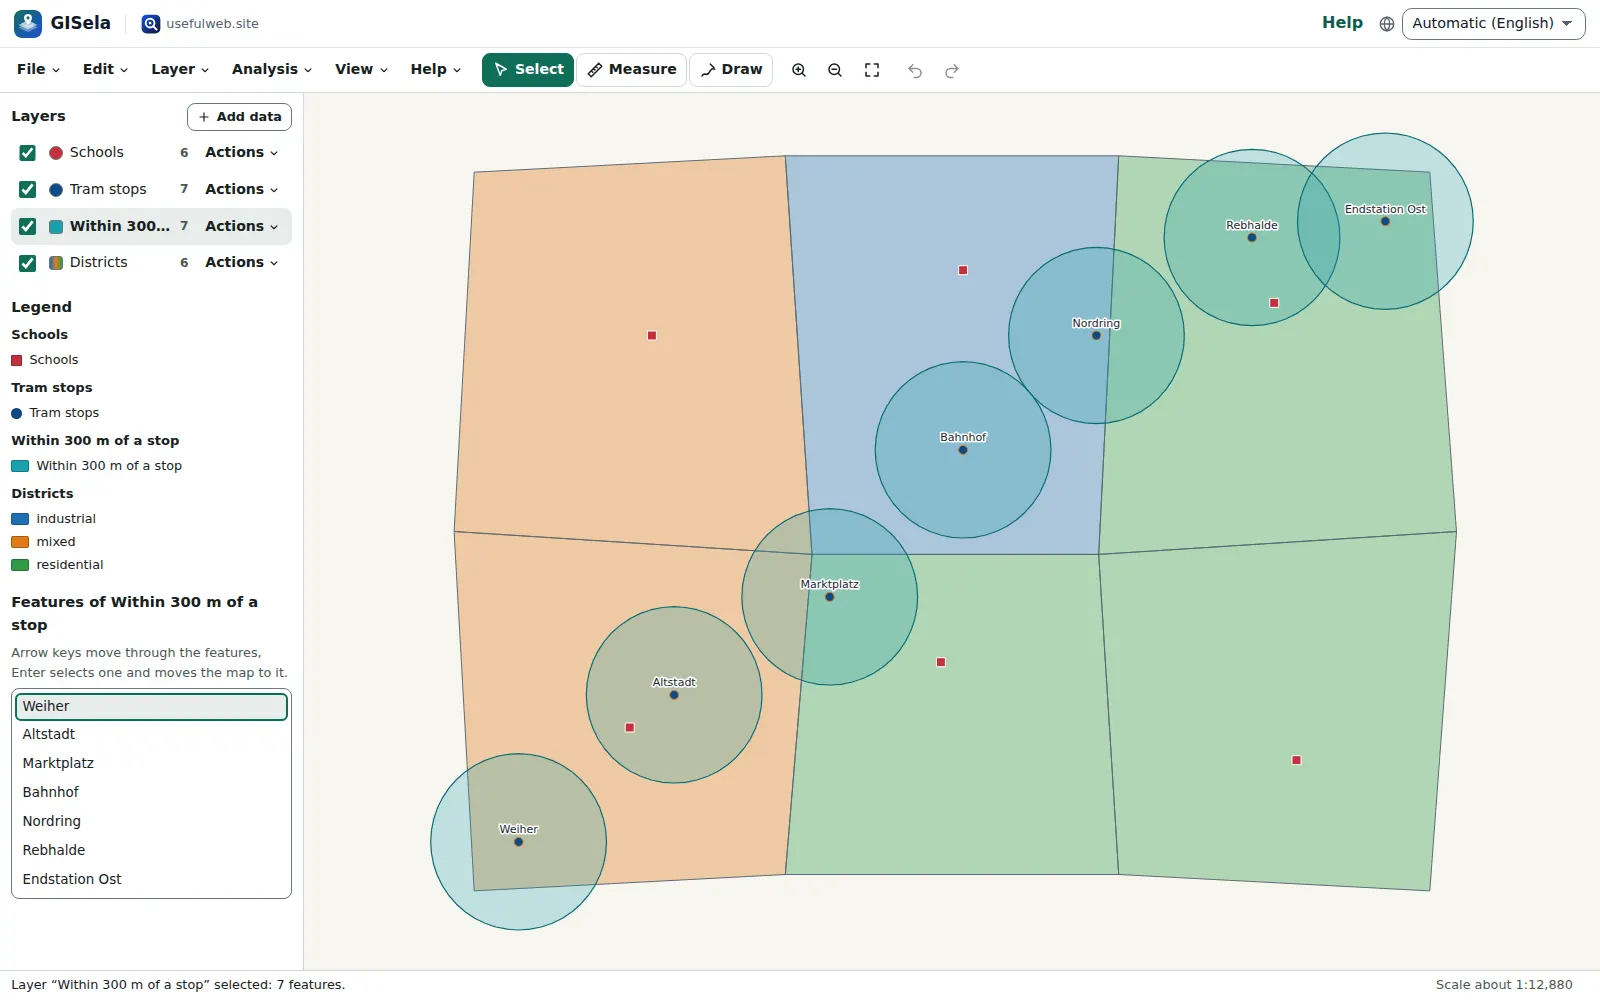 Buffers and overlays
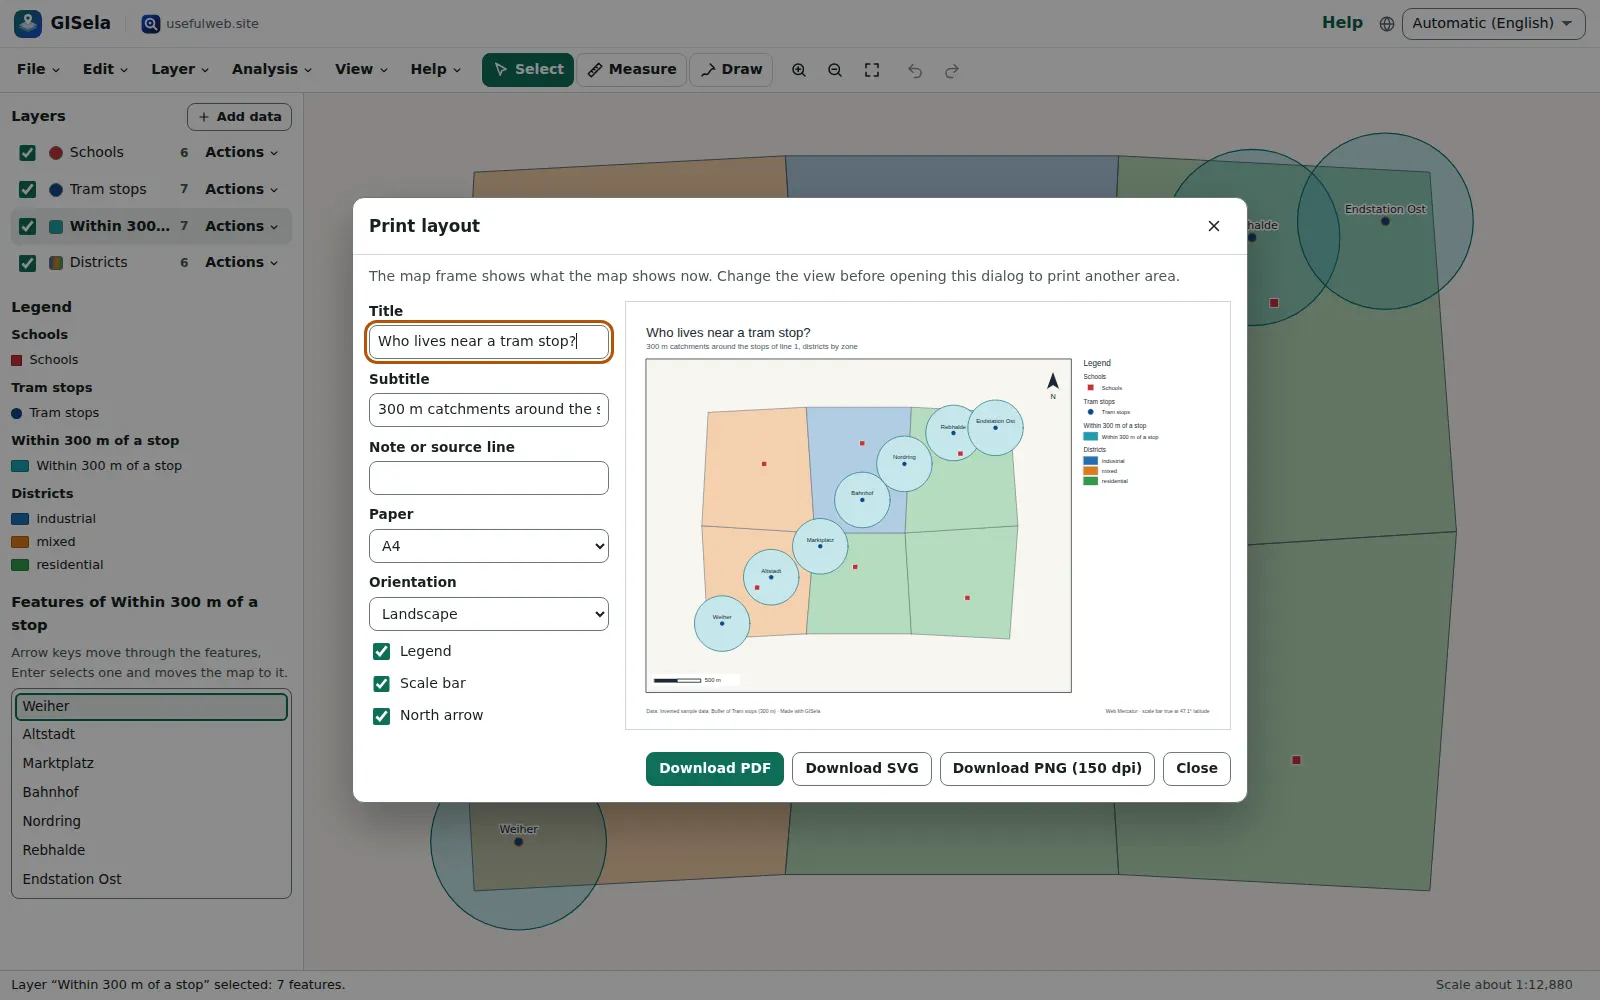 Print layouts as PDF, SVG or PNG
Features
Layers from your files
Open GeoJSON, KML and KMZ, GPX, CSV with coordinates or WKT, TopoJSON and zipped shapefiles. Each file becomes a layer you can show, hide, reorder and rename.
Coordinate systems
WGS 84, Web Mercator, every UTM zone, ETRS89-LAEA, Gauss–Krüger, Swiss LV95 and the British National Grid, read from .prj files and converted on import and export.
Attribute table
Sort, filter and edit values in a real table, select rows to highlight features, and join columns from a CSV file by a key.
Field calculator
Compute new fields with a safe expression language: arithmetic, text functions, conditions, and $area, $length or $perimeter measured on the ellipsoid.
Styles and choropleths
One colour, categories, or classes by equal interval, quantile or Jenks natural breaks, with colour ramps, symbols and labels.
Heatmaps
Turn points into a density surface, weighted by any number field, with an adjustable radius.
Buffers and overlays
Buffer by metres, dissolve by a field, and intersect, clip, erase or unite polygon layers with GISela’s own geometry engine.
Spatial analysis
Centroids, convex hulls, points in polygons, nearest neighbours, Voronoi polygons, simplification and spatial joins.
True measurements
Measure distances and areas on the map, and add area, perimeter or length fields — all geodesic on the WGS84 ellipsoid.
Draw and edit
Draw points, lines and polygons with snapping to existing vertices, move vertices with the mouse, or type them in a vertex list.
Print layouts
Title, legend, scale bar and north arrow on A4, A3 or Letter, exported as vector PDF, SVG or PNG.
Export anywhere
Save layers as GeoJSON, KML, GPX, CSV or a zipped shapefile with .prj, in the coordinate system you choose.
Map without seeing it
A feature list and table describe the map in words; arrow keys step from feature to feature and a screen reader hears each one.
Shared workspaces
Keep a project in a team workspace: changes sync live, and viewers can look but not edit. Without an account everything stays local.
Share links and project files
Autosave with recent projects, undo and redo, .gisela.json files and share links that carry small projects inside the link.
API and MCP tools
Reprojection, buffers, shapefile to GeoJSON and geodesic area and length are also tools with a JSON API for scripts and AI agents.


Templates
Start from a ready-made project and change it to fit.
Town districts (choropleth)
Six districts of an invented town coloured by population density in Jenks classes, with schools, a tram line and district labels — in Swiss LV95.
Capitals of the world
Twenty capital cities on the Natural Earth world map with a graticule, coloured by continent and labelled.
Hiking route
An invented ridge walk with waypoints; the route carries its length on the WGS84 ellipsoid as an attribute.
Bird sightings heatmap
240 invented sightings with species, count and date, shown as a density heatmap weighted by count.
Tram stop catchments
Districts by zone, 300 m buffers around the tram stops and school counts per district from a point-in-polygon analysis.
Built-in tools
GISela uses these tools. Each one also has its own page and works on its own, in the browser, through the JSON API and through MCP.
- GISela Coordinate Reprojection GISela engineConvert GeoJSON, KML, GPX, CSV or shapefiles between WGS 84, UTM, LV95, British Grid and more.
- GISela Buffer GISela engineBuffer zones around points, lines or polygons at a distance in metres, merged or one per feature.
- GISela Shapefile to GeoJSON GISela engineTurn a zipped shapefile (.shp, .dbf, .prj) into GeoJSON in WGS 84 or another coordinate system.
- GISela Area & Length GISela engineTrue area, perimeter and length of polygons and lines on the WGS 84 ellipsoid, per feature.
For AI agents
GISela runs on a deterministic engine. The same functions are available as tools with a JSON API and MCP, so scripts and AI agents get exactly the results the app shows.
- GISela Coordinate Reprojection – Convert GeoJSON, KML, GPX, CSV or shapefiles between WGS 84, UTM, LV95, British Grid and more.
Tool page ·POST https://gisela.usefulweb.app/api/v1/tools/gisela-reproject/calculate· MCPgisela_reproject - GISela Buffer – Buffer zones around points, lines or polygons at a distance in metres, merged or one per feature.
Tool page ·POST https://gisela.usefulweb.app/api/v1/tools/gisela-buffer/calculate· MCPgisela_buffer - GISela Shapefile to GeoJSON – Turn a zipped shapefile (.shp, .dbf, .prj) into GeoJSON in WGS 84 or another coordinate system.
Tool page ·POST https://gisela.usefulweb.app/api/v1/tools/gisela-shapefile-to-geojson/calculate· MCPgisela_shapefile_to_geojson - GISela Area & Length – True area, perimeter and length of polygons and lines on the WGS 84 ellipsoid, per feature.
Tool page ·POST https://gisela.usefulweb.app/api/v1/tools/gisela-area-length/calculate· MCPgisela_area_length
- MCP endpoint (Streamable HTTP):
https://gisela.usefulweb.app/mcp - Project file format (JSON Schema): https://gisela.usefulweb.app/project.schema.json
- OpenAPI description: /openapi.json · llms.txt · API & MCP
Build a project through the API, then open it in the app with a link to https://gisela.usefulweb.app/app#project=<base64url JSON>.
Import & export
Import
- GISela project (.gisela.json)
- GeoJSON (.geojson, .json; also the old “crs” member)
- TopoJSON
- KML and KMZ
- GPX (waypoints, routes, tracks)
- CSV with lat/lon or x/y columns or a WKT column
- WKT (one geometry per line)
- Zipped shapefile (.shp, .dbf, .prj, .cpg)
- Share link (#project=)
Export
- GISela project (.gisela.json)
- GeoJSON
- KML
- GPX
- CSV (x/y or WKT)
- WKT
- Zipped shapefile with .prj
- Print layout as PDF, SVG or PNG
- Map view as SVG or PNG
- Attribute table as CSV
Keyboard shortcuts
| Keys | Action |
|---|---|
| V | Select tool (click a feature) |
| M | Measure distance; again for area |
| D | Draw a feature on the selected layer |
| Arrow keys | Pan the map (on the focused map); in the feature list, step to the next or previous feature |
| + / - | Zoom in or out |
| 0 | Zoom to all layers |
| T | Open the attribute table of the selected layer |
| Enter | Finish a drawing (Escape cancels it) |
| Delete | Delete the selected feature |
| Ctrl + Z | Undo |
| Ctrl + Shift + Z | Redo |
| Ctrl + S | Save project file |
| Ctrl + O | Open a file |
| ? | Keyboard shortcuts (single-key shortcuts can be switched off there) |
Frequently asked questions
Where is my data?
In this browser’s storage (IndexedDB) on this device. Files you open are read in the browser and never uploaded. Save a project file, export layers or back up with Bundlekeep to keep a copy.
Can my team work on the same map?
Yes, with a free account: choose File → Save to workspace… and invite people. Changes sync live; people with the viewer role can look but not edit. Without an account GISela works locally.
Which coordinate systems does GISela know?
WGS 84 and ETRS89 longitude/latitude, Web Mercator, all UTM zones (WGS 84 and ETRS89), ETRS89-LAEA Europe, the German Gauss–Krüger zones 2–5, Swiss LV95 and LV03, and the British National Grid. It reads them from .prj files and GeoJSON, and you can choose them by EPSG code.
How accurate are conversions between datums?
Projections are exact to millimetres. Changing the datum (for example OSGB 1936 or DHDN to WGS 84) uses a published 7-parameter Helmert transformation, good to about 1–5 metres. For survey work use the official grid transformations.
Why does my shapefile not open?
A shapefile is several files. Put at least the .shp, the .dbf and the .prj file into one ZIP and open the ZIP. MultiPatch (3-D) shapefiles are not supported.
How do I use the map without a mouse or without seeing it?
Tab to the feature list: arrow keys move from feature to feature, Enter selects one and the screen reader hears its name and values. The map itself pans with the arrow keys and zooms with plus and minus; drawn shapes can be typed as a vertex list.
Is there a background map with streets?
GISela shows a simple world map of country outlines (Natural Earth). It does not load map tiles from other servers; bring your own data, for example an OpenStreetMap extract converted to GeoJSON.
Limitations
What GISela does not do (yet):
- No street or satellite basemap: the built-in background is a world map of country outlines.
- Raster data (GeoTIFF, images) and 3-D data are not supported; Z and M values are dropped.
- Overlays work on longitude/latitude like a desktop GIS on an EPSG:4326 layer; buffers and distances use a local metric plane.
- Datum shifts use Helmert parameters (about 1–5 m), not national grid files such as OSTN15 or BeTA2007.
- Coordinate systems outside the built-in list cannot be read or written.
- Large datasets (more than 50,000 features per layer) are not supported, and drawing slows down above a few thousand complex features.
- No geocoding (address search); place data comes from your files.
Tutorials
Learn GISela step by step.
- Your first map in five minutesOpen a GISela template, find your way around layers, legend and map, select features with the mouse or the keyboard and keep your project in this browser or in a file.Beginner 5 min
- Import data and choose coordinate systemsAdd GeoJSON, shapefiles, KML, GPX, CSV, WKT and TopoJSON to a map, read CSV files with Swiss or UTM coordinates, and show coordinates in the system you work with.Beginner 8 min
- Styles, classes, labels and heatmapsColour features by category or in classes (equal interval, quantile, natural breaks), choose symbols and labels, and show many points as a heatmap.Intermediate 7 min
- Attribute table, filters and the field calculatorSort and edit attributes, filter features with expressions, compute new fields such as density, and join a CSV table by a key.Intermediate 8 min
- Buffers, overlays and spatial analysisDraw buffer zones, intersect and clip layers, count points in polygons, find nearest neighbours, make Voronoi polygons, simplify lines and join by location.Advanced 10 min
- Measure, print, export and shareMeasure distances and areas on the ellipsoid, make a print layout as PDF, SVG or PNG, export layers as shapefile, GeoJSON, KML, GPX or CSV, and share a project by link or in a workspace.Beginner 8 min
Ready to try it?
Other apps
-

Twinworks
Factory digital twin & production simulation
Model a production line, simulate it and find the bottleneck — free, in your browser.
-

Learning Shorts
Animated explainer video studio
Turn an idea into a narrated, animated short video with presenters, props and captions.
-

Chainscope
Web3 investigation desk
Investigate transactions, bridges, contracts, DAOs and wallets in one case file.
-

RavingDesk
Paper trading & data workspace
Practise trading on paper and chart your data: orders, risk, datasets, analyses, reports.
-

Lumina
Photo editor & image toolkit
Bring out what you saw. A free photo studio, right in your browser.
-

Ledgerly
Household finance & life-admin desk
Budgets, bills, subscriptions, loans, contracts and deadlines on one private desk.
-

Ohmforge
Virtual electronics workbench
Draw a circuit, switch it on, and measure it with real-feeling bench instruments.
-

Flipline
Drawing, storyboards & animation
A few drawings. A little life. Make a flipbook in your browser.
-

Hearth
Home & travel planner
Plan meals, chores, home care, moves, trips and good days for your household in one place.
-

Playcards
Card games table
33 card games from Skat and Jass to Scopa and Daifugō, vs the computer, at home or online.
-

Soundscape Atlas
Sound map & ambience studio
Find real field recordings on a world map and mix them into calm, editable soundscapes.
-

ObscurIQ
OSINT case desk
Organize public-source research: cases, a research log, pivots and indicators.
-

Kerfwise
Cabinet & furniture CAD
Design cabinets and furniture, get cut lists, optimised sheet layouts, costs and drawings.
-

Proofline
Math notebook
Solve, graph, test and visualise in one notebook — with data, findings and a report.
-

Signalhouse
Website & internet infrastructure inspector
Inspect DNS, TLS, mail, CDN and routing of all your domains — and see what changed.
-

Opsdeck
Developer & ops workbench
One deck for CI failures, cron, traces, k8s events, API diffs, query plans and Terraform.
-

Reelcraft
Audio, video & image batch studio
Audio, video & image batch studio: cut, convert, compress, subtitle, reframe
-

Paperwell
Document studio: PDFs, OCR, redaction, forms & contract reading
Your paperwork in one dossier: PDF tools, OCR, redaction, forms and contract reading.
-

Renderloom
3D scene & material studio
Shape a scene. Find its light. Keep every idea editable.
-

Keysmith
Crypto & secrets lab
Audit certificates, keys, TLS and passwords in one lab; secrets stay on your device.
-

Fieldday
Sports club & training organiser
Fixtures, brackets, ratings and training plans for your club — in one workspace.
-

Threadsmith
Embroidery digitizing studio
Draw or import artwork, turn it into stitches, export DST, PES, JEF or EXP files.
-

Provenance
Software supply-chain security desk
SBOMs, CVEs, containers and licences in one risk register — free, in your browser.
-

Agentlab
AI-agent & LLM workbench
Test an AI agent before release: permissions, traces, costs, citations and output checks.
-

Pageboard
Website inspiration boards
Collect website references, sort them with tags and arrange them on a moodboard.
-

Tonegrid
Tone matrix & beat sequencer
Light up squares to build melodies, beats and acid bass, then arrange them into songs.
-

Printshop
Printables studio
QR codes, calendars, labels, puzzles and posters — print-perfect PDFs in seconds.
-

Panelcraft
Comic books & figure references
Shape a page. Arrange a book. Give your story a voice.
-

Bundlekeep
Local project backup
Back up projects from every usefulweb app into one file, check it and restore any part.
-

Kinetica
Robot motion studio
Simulate robot arms in your browser: kinematics, trajectories, collisions, program export.
-

Cartograph
Map posters, route art & atlas
Map prints, GPS-art routes, fair meeting points, true sizes, flags and country quizzes.
-

Skyfold
Sky & space atlas
See the sky of any place and moment, plan eclipses and satellite passes, print star maps.
-

Focus Room
Ambience player & focus timer
A calm room for your screen: ambience, slow visuals, focus timers, clocks and big signs.
-

Deckwright
Slide deck studio
Write Markdown, get an accessible slide deck — charts, diagrams, PDF, HTML and PowerPoint.
-

Sizewise
Scale & big-number visualiser
Make sizes, amounts and big numbers feel real: to-scale lineups, fit counts and stacks.
-

Timeslice
Time tracker & timesheets
Track time on your own tasks, see where it went in charts and share a read-only report.
-

Laneboard
Kanban boards
Kanban boards in your browser: lists, cards, checklists, due dates and flow charts.
-

Wikinest
Knowledge base and team wiki
A team wiki: spaces, page trees, versions, comments and permissions per space.
-

Trackwell
Issue tracker
Issue tracking with workflows, sprints, SLAs and team roles, in your browser.
-

Codeharbor
Coding IDE
A coding IDE in your browser: edit, preview and run web projects safely, then share them.
-

Greenplot
Garden planner & manager
Plan your garden to scale, sow on time, log every harvest and share the plot.
-

Rapport
CRM
A CRM for contacts, companies, deals and quotes — local-first, shared with your team.
-

Sketchboard
Diagrams, sketches and plans
Draw diagrams, flowcharts, mind maps and floor plans on an endless board.