Tutorial 5 of 6
Buffers, overlays and spatial analysis
Advanced 10 min
Draw buffer zones, intersect and clip layers, count points in polygons, find nearest neighbours, make Voronoi polygons, simplify lines and join by location.
The Analysis menu turns layers into new layers. Every tool shows what it does, runs in the browser and adds its result as a new layer at the top; Undo removes it again.
Buffers
A buffer is the area within a distance of a feature. Open Tram stop catchments, select Tram stops and choose Analysis → Buffer…. Set the distance to 500 metres and tick Merge overlapping zones.
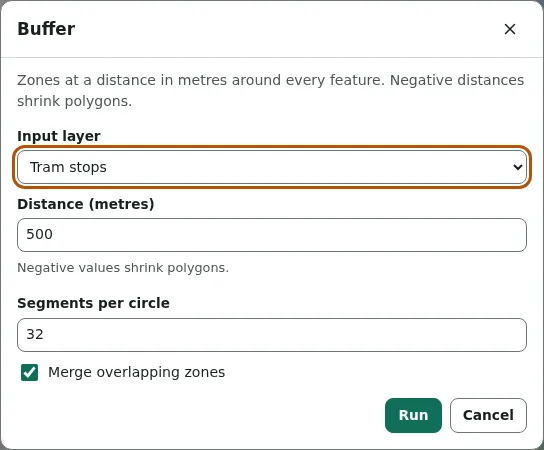
The status line reports Buffered 7 features by 500 m. Merged, the seven circles become one area, so the overlaps are not counted twice. Negative distances shrink polygons — useful for "at least 50 m inside the border". Distances are measured in metres on a local map projection around the data; areas on the WGS 84 ellipsoid.
Count points in polygons
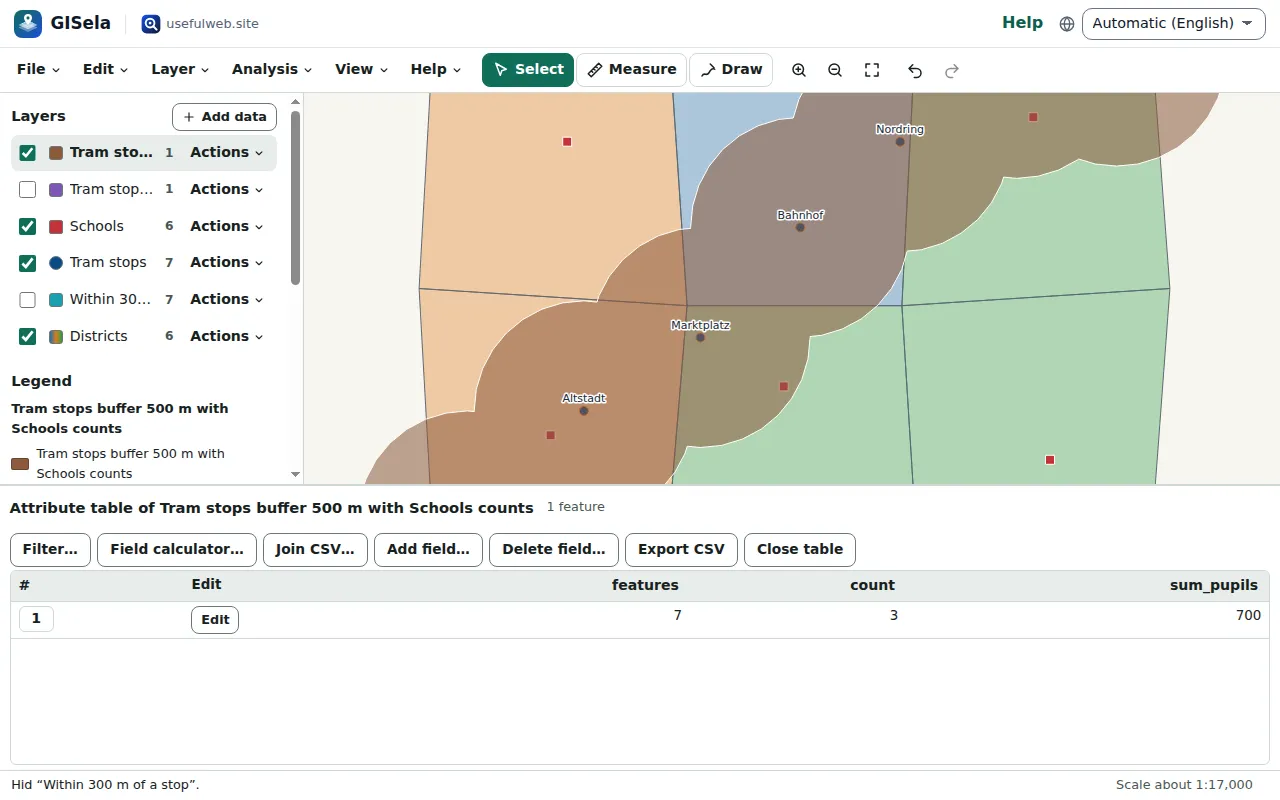
Analysis → Count points in polygons… counts the points inside each polygon and can sum a field. With the 500 m zone as polygons, Schools as points and the sum of pupils: Counted 3 of 6 points inside 1 polygon. — three schools with 700 pupils are within 500 m of a tram stop.
Overlays
The overlay tools combine a layer with polygons:
- Intersect — the parts that overlap, with the attributes of both layers;
- Clip — the parts inside the overlay;
- Difference (erase) — the parts outside;
- Union — all pieces of two polygon layers, split where they overlap.
Intersect plus difference always give back the whole input: GISela's overlay splits all edges at their crossings and decides piece by piece, so shared borders and holes come out exact.
More tools
- Dissolve merges features with the same value of a field (or all of them) and removes inner borders.
- Centroids — one point per feature, area-weighted for polygons.
- Convex hull — per feature, per group or around the whole layer.
- Nearest neighbour — for each feature, the nearest feature of another layer and its distance in metres.
- Voronoi polygons — the area closer to each point than to any other, optionally clipped to polygons. With the tram stops, clipped to the districts, this shows which stop is nearest from anywhere in town.
- Simplify — fewer vertices, by Douglas–Peucker (tolerance in metres) or Visvalingam–Whyatt (tolerance in square metres). The status line reports how many vertices were kept.
- Spatial join — adds the attributes, the number or a sum of touching features of another layer.
- Add area and length fields — area and perimeter, length, or longitude and latitude, measured on the ellipsoid.
Limits
Layers hold up to 50,000 features. Analysis runs in the page, so very detailed polygons (hundreds of thousands of vertices) take a few seconds; simplify them first.
Ready to try it?